FracSTAT Home Page
The launcher serves as the primary entry point and home screen for the entire FracSTAT application. It operates as a single root window that embeds both the Analyzer modules and project settings, allowing the software to behave as one continuous desktop program without opening multiple detached windows.
On this page
Application Workflow
Before exploring the user interface, it is helpful to understand where the launcher sits within the broader FracSTAT processing pipeline. The diagram below illustrates the start-to-finish workflow, beginning with data preparation and routing through the GUI into the specific calculation modules.
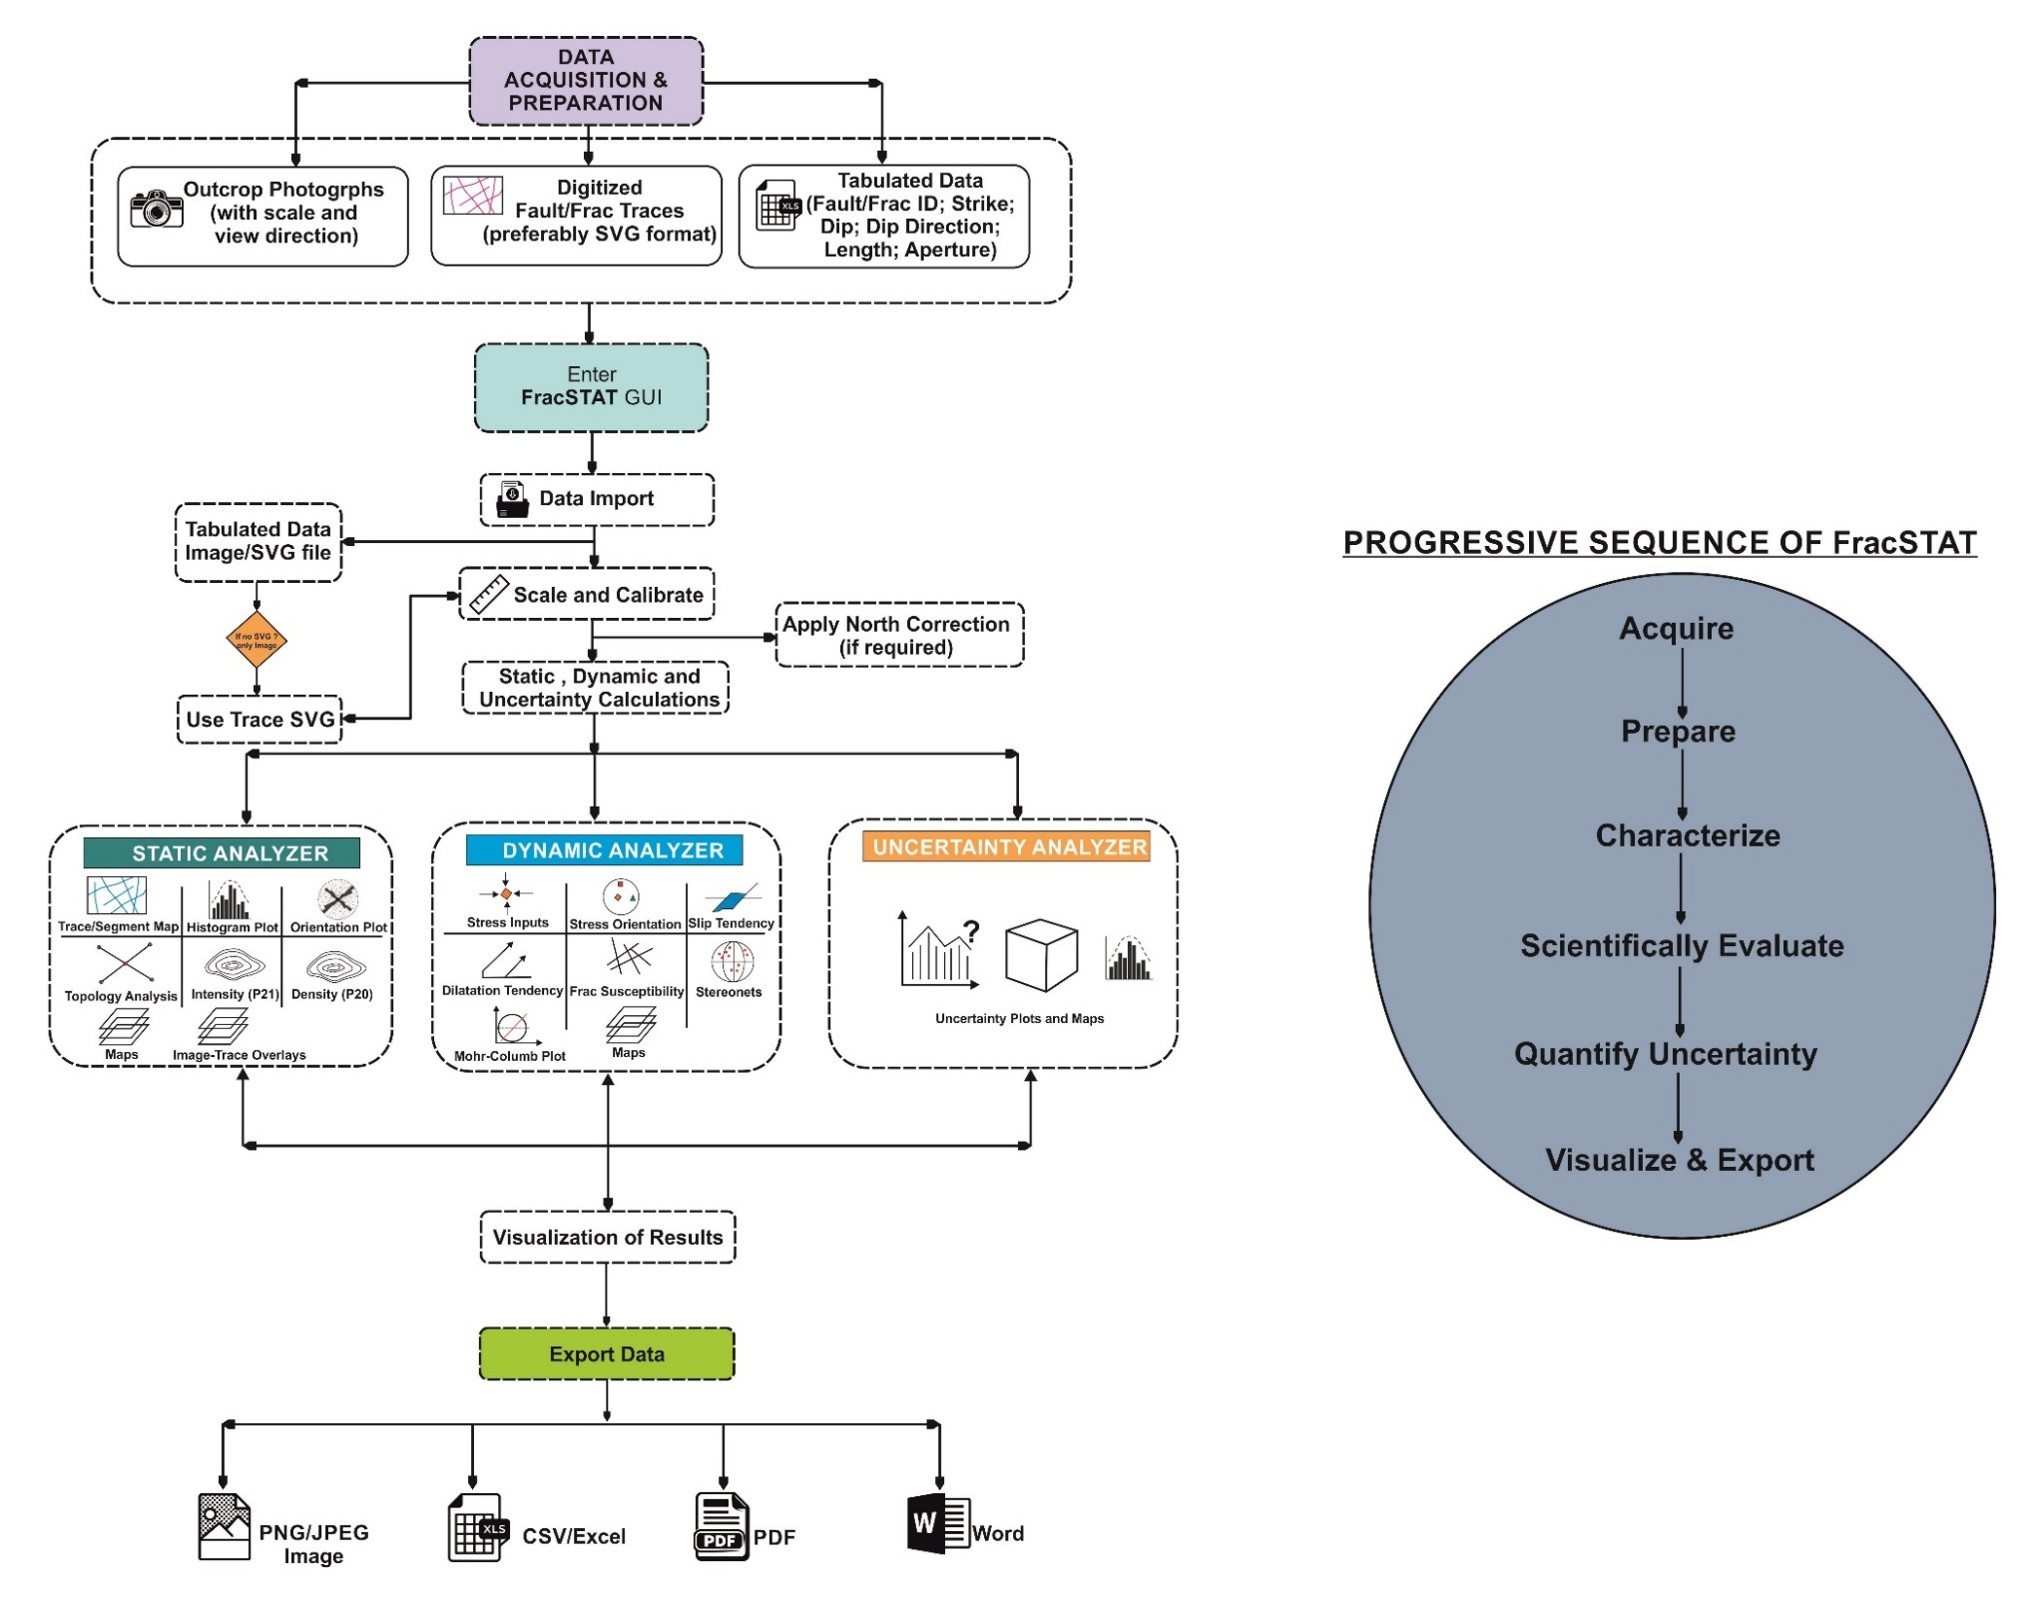
The general workflow includes:
- Data Acquisition & Preparation: Start with outcrop photographs (including scale and view direction), digitized fault/fracture traces (preferably in SVG format), or tabulated data (Fault/Frac ID, Strike, Dip, Dip Direction, Length, Aperture).
- Enter FracSTAT GUI: Use the launcher to import data, scale, and calibrate.
- Calculations: Choose between the Static Analyzer (for Trace/Segment Maps, Histogram Plots, Orientation Plots, Topology, Intensity, etc.), Dynamic Analyzer (for Stress Inputs, Slip Tendency, Dilatation Tendency, Mohr-Coulomb Plots, etc.), or the Uncertainty Analyzer (for Uncertainty Plots and Maps).
- Visualization & Export: Export your finalized results as PNG/JPEG images, CSV/Excel spreadsheets, PDFs, or Word documents.
Navigating the Launcher Interface
The Home Window is designed to be user-friendly, organizing project management on the left and analytical modules on the right.
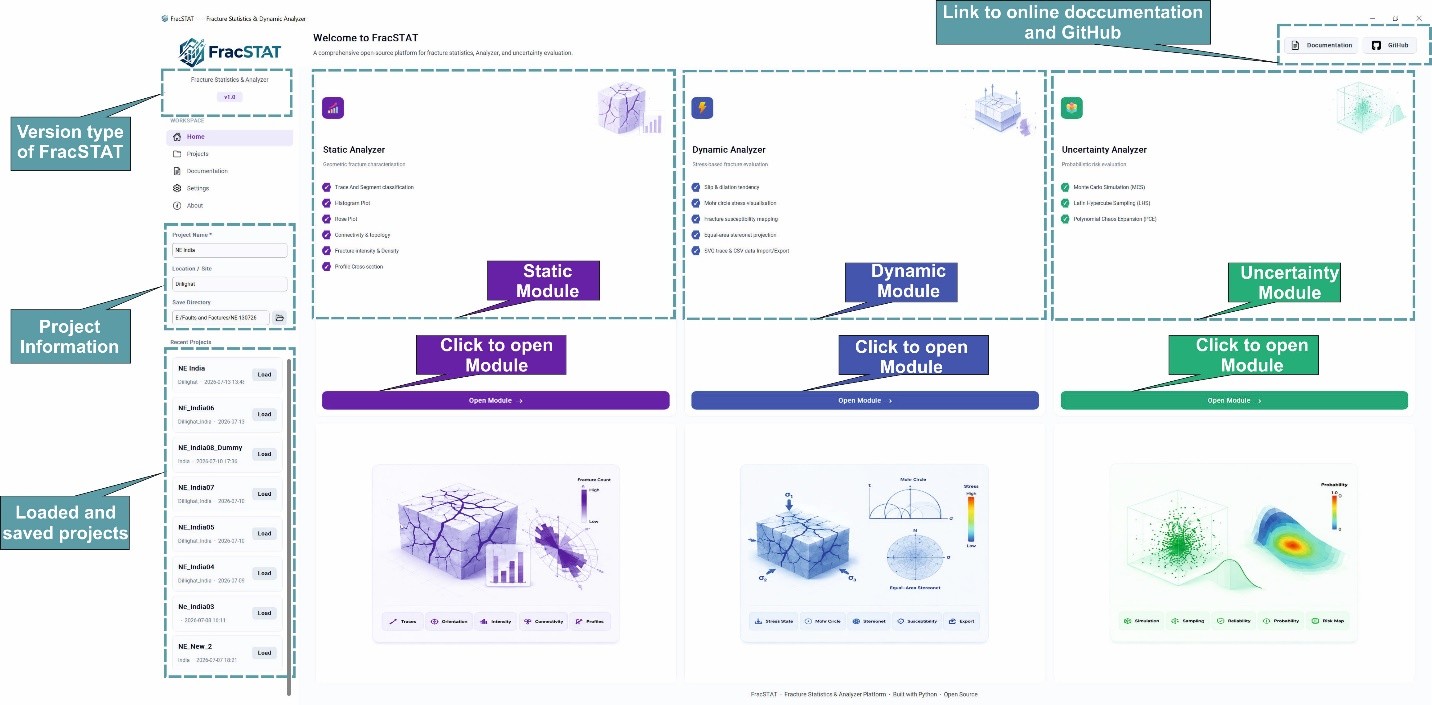
1. The Sidebar (Left Panel)
The left panel is your control center for application navigation and managing project files.
- Version Type of FracSTAT: A badge below the logo indicates your current running version (e.g., v1.0).
- Workspace Navigation: Use the sidebar links to switch between Home, Projects, Documentation, Settings, and About pages.
- Project Information: A dedicated form allows you to easily create a new workspace. Only the Project Name is mandatory (marked with an asterisk); a Location / Site is optional, and the Save Directory defaults to your home folder if you do not browse for another one. Fill all three anyway — the location is what labels the entry in the Projects list, and the save directory is where per-project session state is written so a workspace reopens where you left it.
- Loaded and Saved Projects: A scrollable "Recent Projects" list allows you to quickly load previous sessions with a single click.
2. The Top Header Bar
The top right corner of the home interface provides two shortcut buttons:
- Documentation: Opens the built-in Documentation page inside the launcher — it does not leave the application or require a network connection.
- GitHub: Opens the project's source-code repository in your default web browser.
3. The Module Cards (Main View)
The center of the launcher features three large interactive cards corresponding to the primary FracSTAT modules. Each card highlights the tools available within.
- Static Module: Focused on geometric fracture characterization. Features include Trace and Segment classification, Histogram Plots, Rose Plots, Connectivity & topology mapping, Fracture intensity & Density, and Profile Cross-sections.
- Dynamic Module: Focused on stress-based fracture evaluation. Features include Slip & dilation tendency, Mohr circle stress visualization, susceptibility mapping, and stereonet projections.
- Uncertainty Module: Dedicated to probabilistic risk evaluation, with a Monte Carlo Simulation (MCS) tab and a Latin Hypercube Sampling (LHS) tab. Both are full workspaces in v1.0.0 — each opens the same six analysis modules (Geomechanics, Statistics, Sensitivity, Visualization, Spatial Probability Map, and Validation & Export) and differs only in how the uncertain stress inputs are sampled.
- Click to open Module: At the bottom of each card is a prominent button used to launch that specific environment with your defined project parameters.
Exploring Application Pages
The launcher includes several dedicated pages to help you manage your workspace, access help, and configure global preferences.
- Projects Page: View and manage all your recent workspaces. You can easily load existing sessions, delete old ones, import a portable project, or quickly create a new project from this menu.
- Settings Page: Customize your global application preferences, grouped into six sections: Workspace Text (plot font family, size, bold, colour), Default Stress Parameters (σ1, σ2, σ3, σ1 azimuth, friction coefficient, cohesion, pore pressure), Analyzer Defaults (curve step, fracture dip, profile width and length, Y-axis azimuth, display units), Dynamic Analyzer and Static Analyzer (default map mode and colour scales), and Export (plot DPI, default export directory, number of recent projects shown). Changes take effect once you press Save Settings; Reset Defaults restores the shipped values.
- Trace Map Guide: Follow the complete image-to-SVG digitizing workflow, including drawing and editing tools, layers, image enhancement, crop and canvas controls, save/export behavior, quality checks, and the full keyboard and mouse key map.